Introduction
Parks and playgrounds are important spaces that provide opportunities for physical activity. However, there is still limited evidence on whether redesigning or renovating these spaces leads to increased physical activity.
One reason is that studies of park and playground renovations are often conducted in real-world settings, which can present a range of challenges. As a result, there is a need for new methods that can better capture contextual conditions and improve both the efficiency and scope of evaluations.
To help advance the evidence from park and playground natural experiments, Kathryn and colleagues (2026) conducted a comparative case study of two park and playground renovations in low-income, predominantly Black neighbourhoods in the United States, located in Baltimore, Maryland, and Rocky Mount, North Carolina.
For each study, the researchers 1) adapted the Guide for Evaluating Playground Interventions to systematically describe and compare study context, 2) conducted a quasi-experimental study using traditional methods, and 3) compared these findings with geolocation mobile device data.
The findings are particularly relevant for city planners, playground and park designers, and researchers and evaluators working with public space interventions.
Key findings
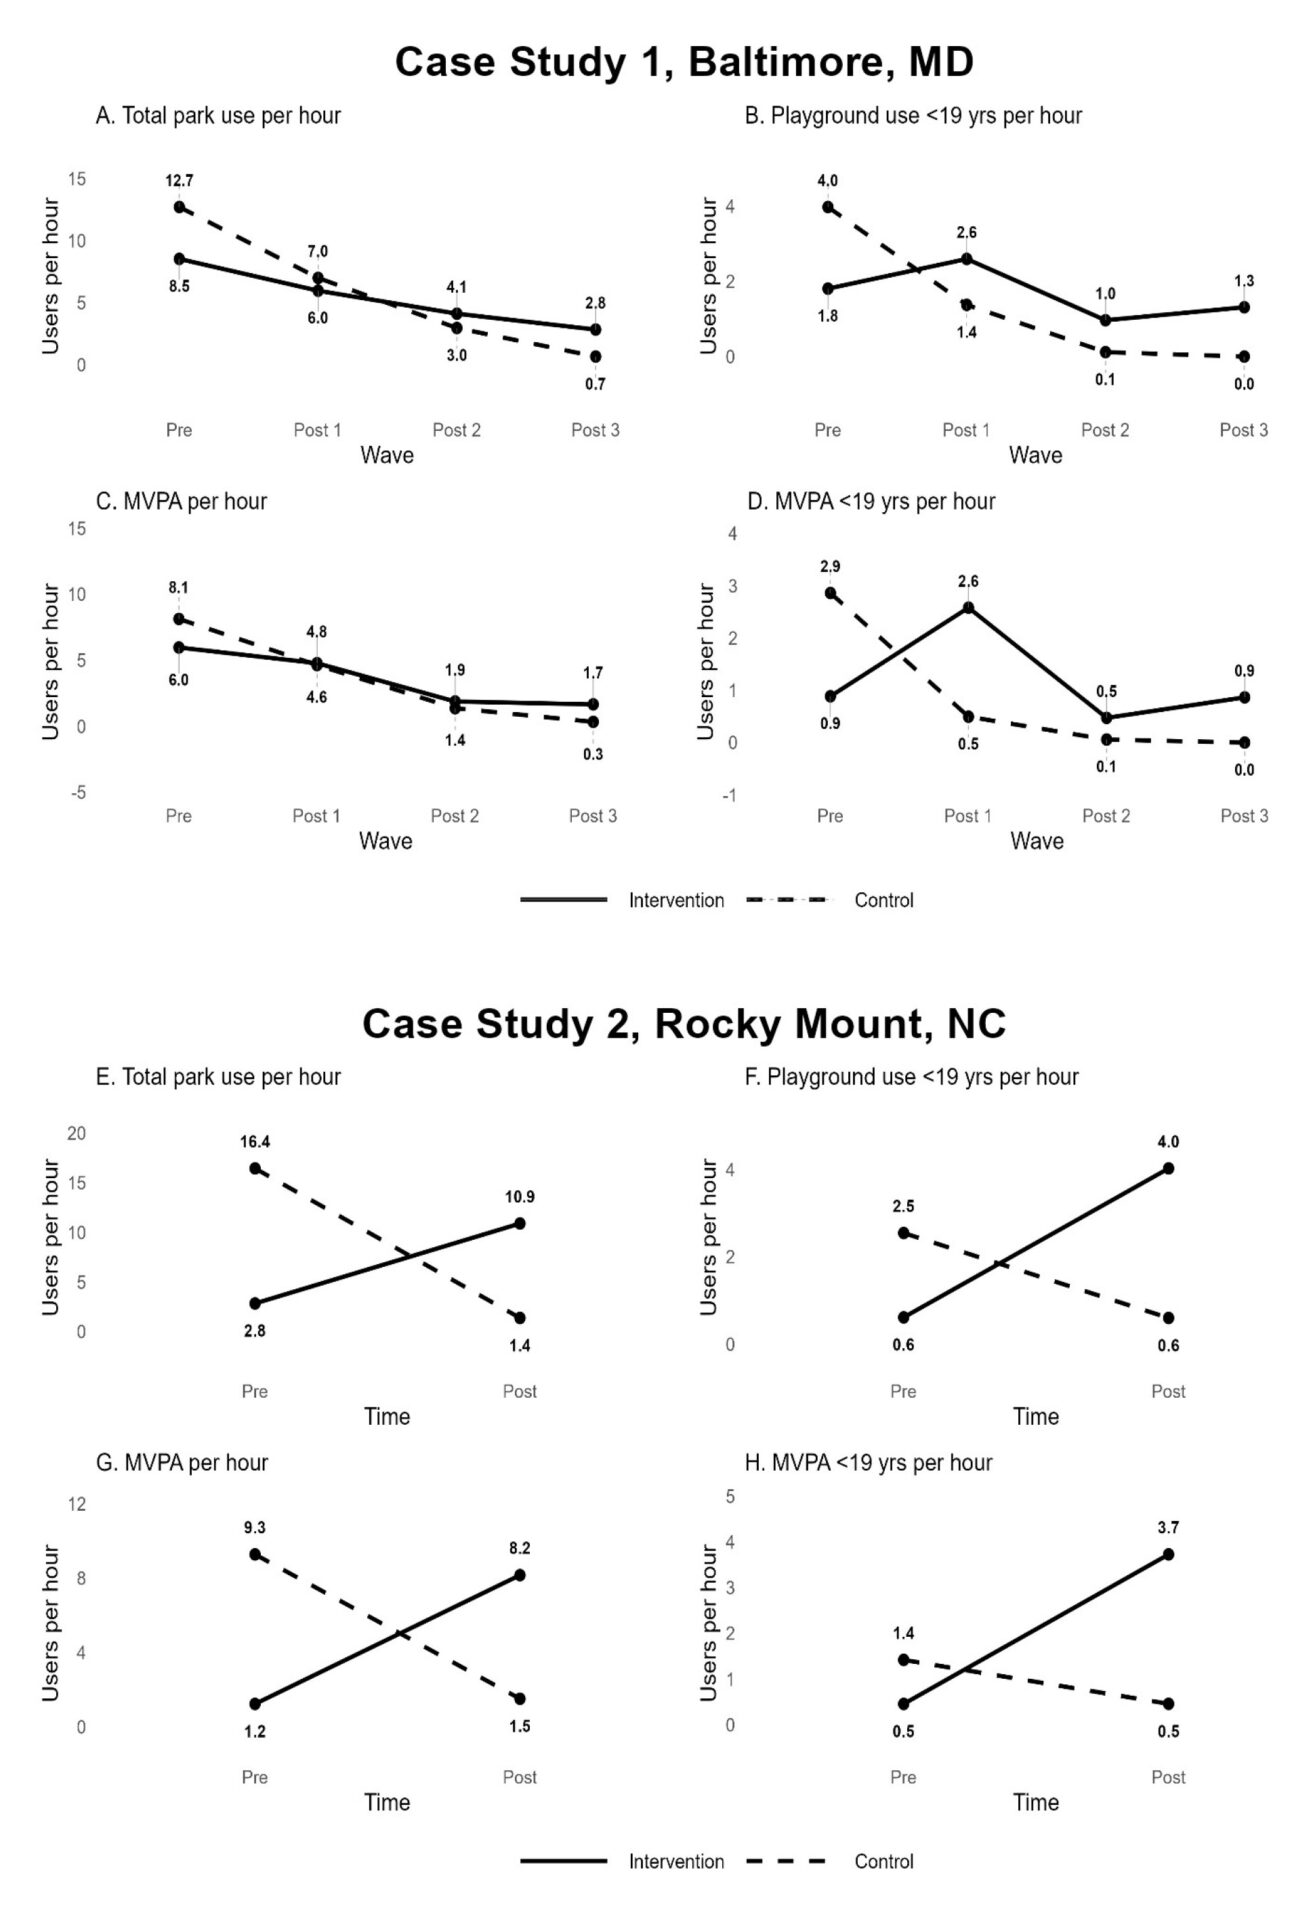
Notes: For case study 1, “Pre” data includes: December 04 to December 15, 2018, and “Post” data includes: Wave 1: December 04 to December 12, 2019; Wave 2; December 09 to December 19, 2021; Wave 3; December 03 to December 17, 2022. For case study 2, “Pre” data includes: September 23 to October 17, 2023, and “Post” data includes. Figures adjusted for weekend vs. weekday. Abbreviations: yrs= years; MVPA = moderate-to-vigorous physical activity.
Park and playground use increased in one case study, but not the other
Using the System for Observing Play and Recreation in Communities (SOPARC), researchers found different results across the two case studies.
As shown in Figure 1, there was no significant change in park or playground use, or in physical activity levels, following the renovation of the intervention park in Baltimore, MD. In contrast, all study outcomes increased significantly following the renovation of the intervention park in Rocky Mount, NC.
Geolocation data showed similar patterns over a longer period
The findings based on geolocation mobile device data followed a similar pattern to the SOPARC observations for playground use across both case studies and for both intervention and control parks.
However, the geolocation data covered a much longer observation period, with approximately six months of data from Placer.ai, compared with a few weeks for SOPARC. In addition, the geolocation data were analysed at the weekly level, whereas SOPARC results were based on hourly observations.
Context matters in playground evaluations
Using the adapted Guide for Evaluating Playground Interventions, researchers documented a range of contextual factors that may help explain the differences in findings between the two case studies. These factors included:
- Timing of data collection (winter versus fall/spring, and pre-versus post COVID-19)
- Neighbourhood demographics
- Community involvement
- Park size
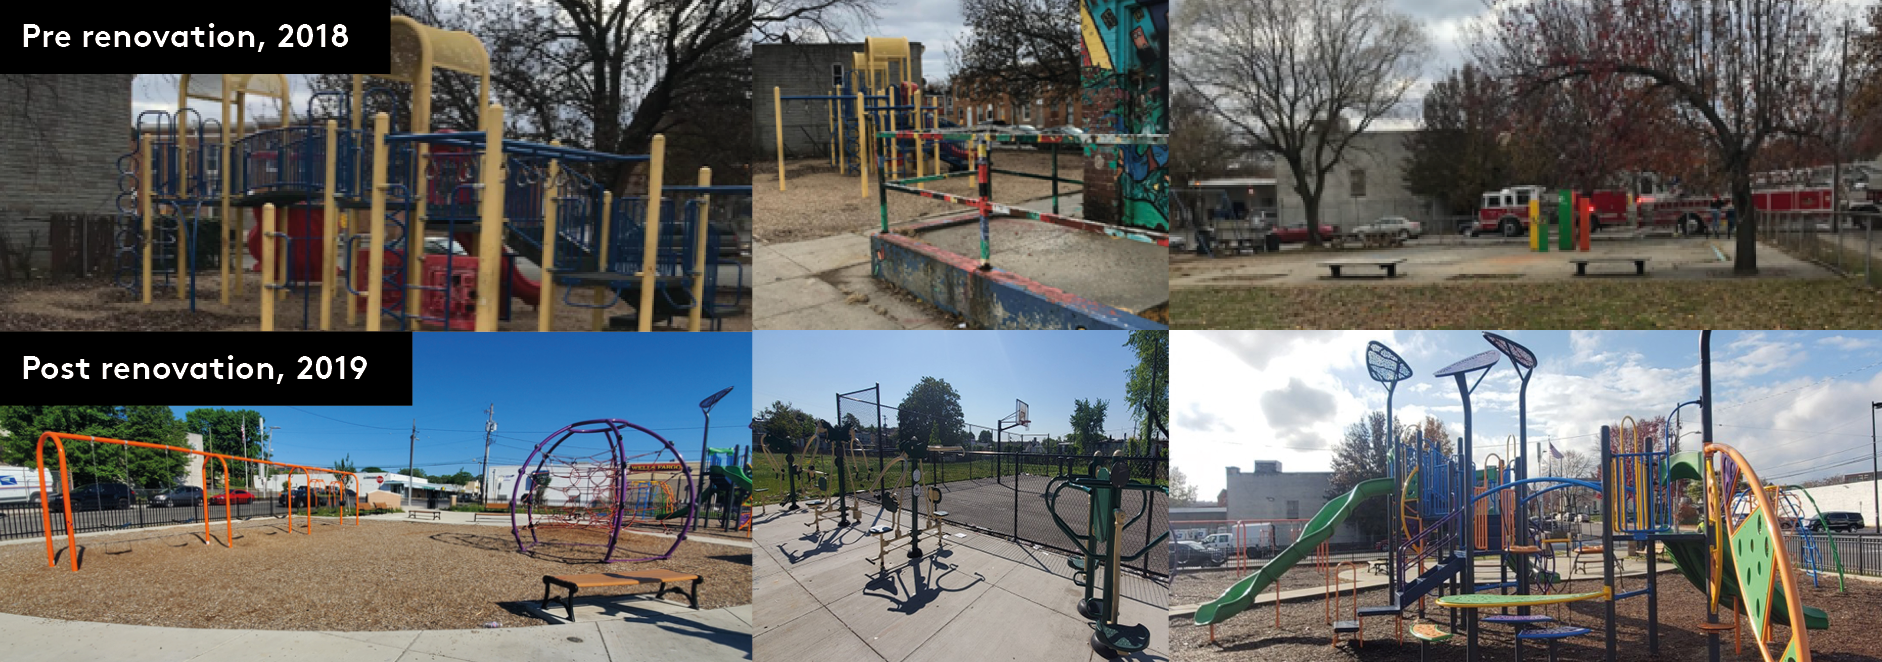
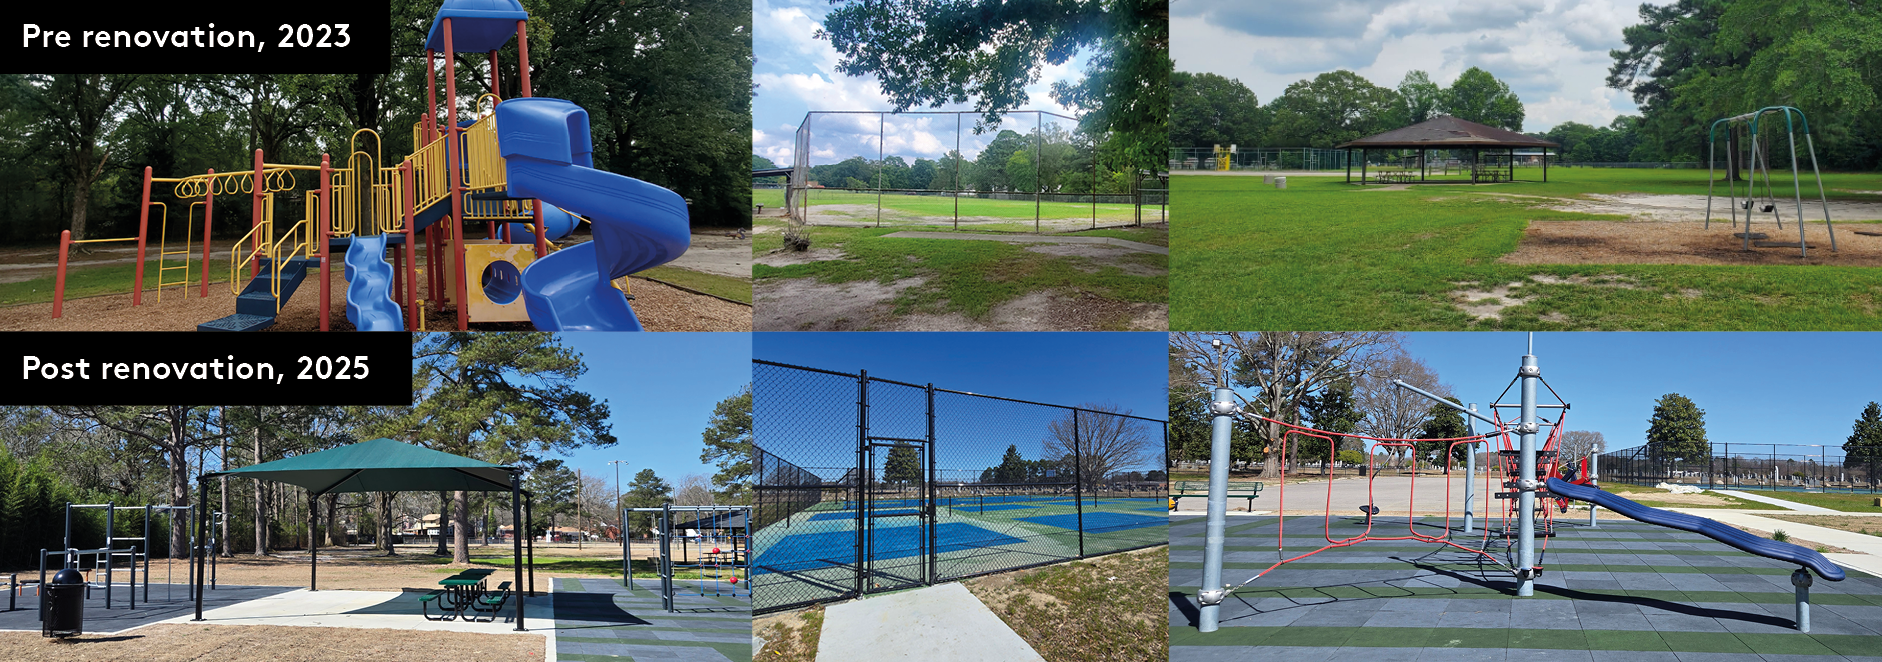
- Renovated amenities (Figure 2)
For example, observations in Baltimore began in 2019 and ended in 2022. During this period, the COVID-19 pandemic was associated with a decline in the population living near the park. As a result, fewer residents may have been exposed to use the renovated park.
Before and after park and playground renovations
Recommendations for future evaluations
The Guide for Evaluating Playground Interventions provides an easy-to-use approach for systematically documenting contextual factors that may influence evaluation results. By capturing these factors in a structured way, the guide can help improve transparency and support the interpretation of findings across different settings.
For evaluations using SOPARC or other observation methods, researchers and practitioners should consider factors such as available resources, the timing of data collection, and the formal evaluation of community engagement throughout the renovation process.
The study also highlights the potential of geolocation mobile device data as a scalable and efficient way to measure park and playground use. However, further validation is needed before this method can be used independently in rigorous evaluations. In addition, geolocation data cannot capture information about children who visit playgrounds.
Implications
This study represents an important step forward in evaluating park and playground renovations in vulnerable communities and in testing emerging methods that may strengthen future evaluations.
The findings provide some evidence that park and playground renovations can increase park and playground use as well as physical activity following renovation.
The results for playground use were broadly consistent when measured using mobile device geolocation data, suggesting that this approach may offer a useful complement to traditional evaluation methods.
The researchers hope these findings will help inform cities and towns about the value of investing in park and playground renovations and the importance of supporting rigorous evaluations of these efforts.
This brief is based on
Burford, K.G., Han, J., Piotrowski, E. et al. Implementing emerging methods to improve evaluations of playground and park renovations: a comparative case study on park use in low-income, predominantly black communities. Int J Behav Nutr Phys Act (2026). https://doi.org/10.1186/s12966-026-01977-y
Download the brief
Improving evaluations of park and playground renovations
4,3 MB